


Long before the Hudson Valley became one of the Northeast’s most celebrated landscapes, it was home to the Lenape and Mahican peoples, nations who lived along the river’s banks for thousands of years, cultivating a deep relationship with the land’s forests, waterways, and fertile valleys. They named the river Muhheakantuck, meaning “the river that flows two ways,” a reference to its tidal nature that speaks to how intimately these communities understood the natural world around them.
European contact came in 1609, when Dutch explorer Henry Hudson sailed upriver on behalf of the Dutch East India Company, setting in motion a period of trade and, eventually, colonial settlement. By the 1620s, the Dutch had established fur trading posts along the river, and the region that would become New York began to take shape. The pastoral estates, stone farmhouses, and river towns that followed were built on terrain with a history stretching back millennia, giving the Hudson Valley a cultural and geographic depth that few American regions can match.
The region played key roles throughout both the Revolutionary War and the Industrial Revolution. The Hudson River served as a vital strategic corridor during the war, and later as a primary artery for moving raw materials and manufactured goods across the Northeast. That layered history means some of the nation’s oldest homes, estates, and towns are concentrated here, many of which still stand in remarkably preserved condition. Today, the Hudson Valley is typically divided into three distinct regions: Upper, Mid, and Lower Hudson, spanning 10 counties, each with its own characteristics and allure.
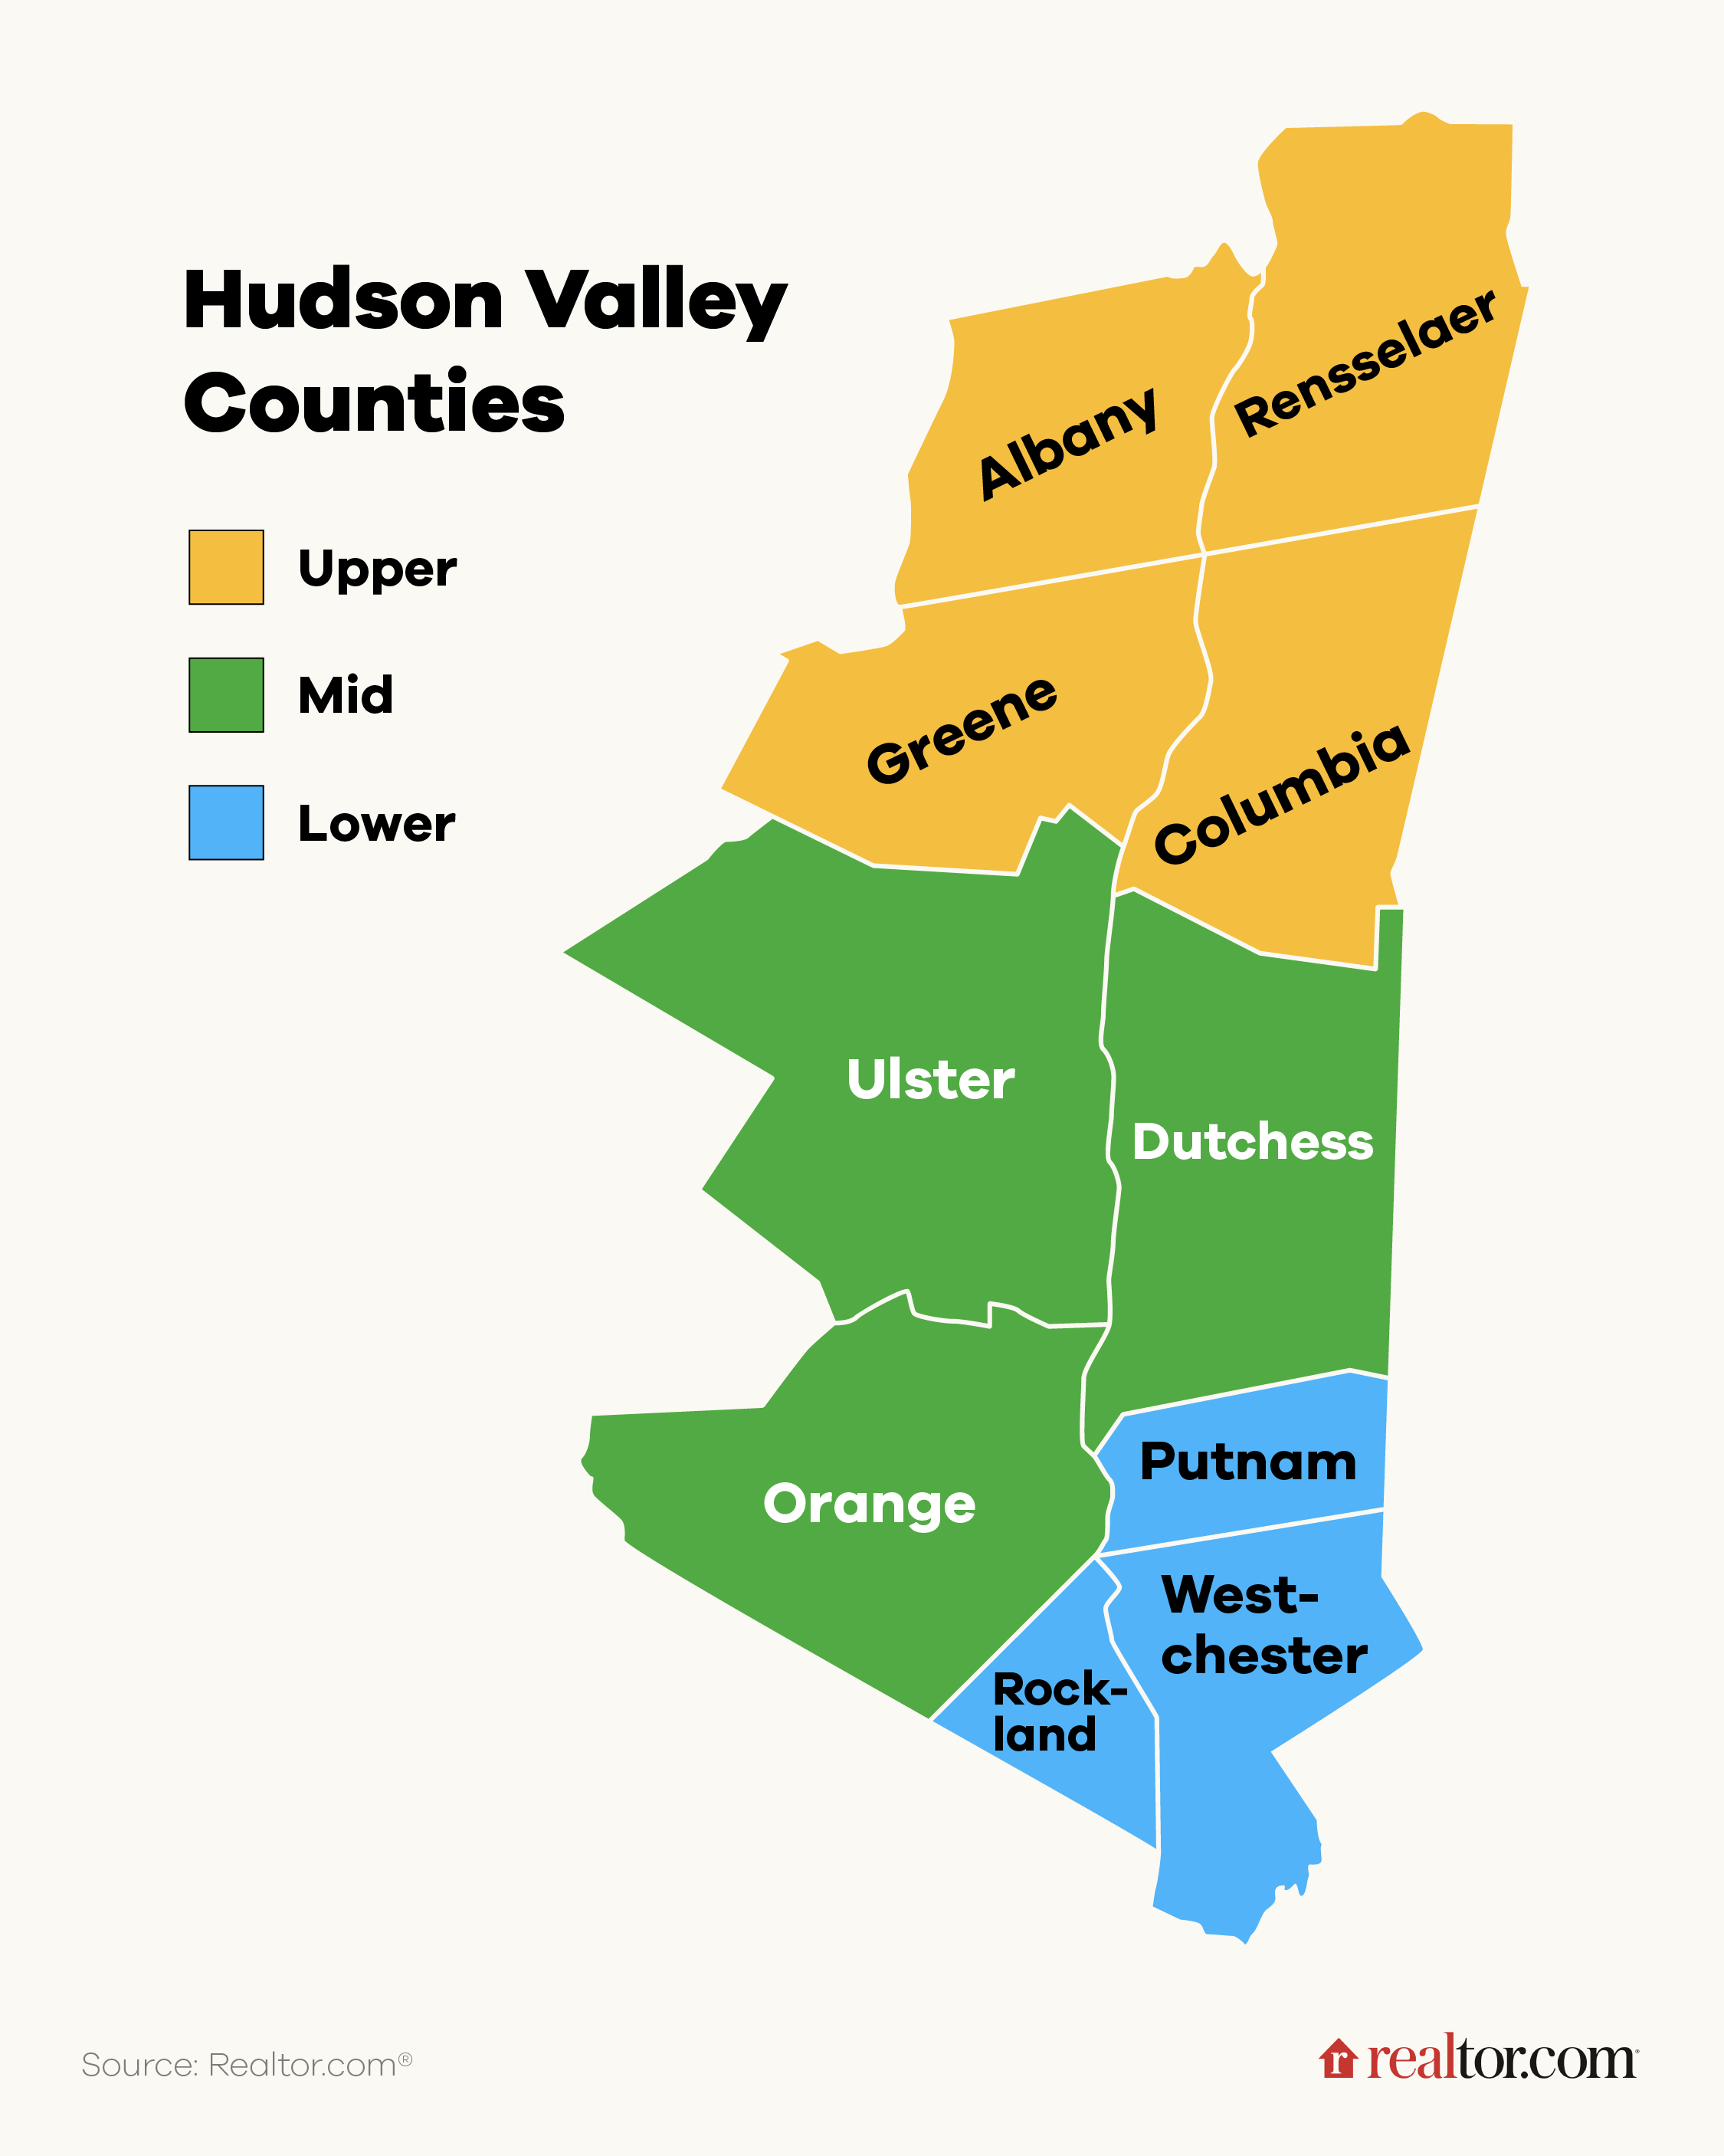
The Lower Hudson is where the valley and the city meet. Westchester has been the premier address for New York’s professional class for more than a century: its Tudor-style estates, colonial revivals, and stone manors are the backdrop for a way of life built around Metro-North access, country clubs, and communities whose reputations were established generations ago. Rockland, on the river’s western bank, has been catching up quickly, with a waterfront character, a more affordable entry point relative to Westchester, and a commuter identity that is drawing sustained migration from buyers priced out of the county to the east. Putnam, bookended between Westchester and Dutchess, offers the transitional identity of both: close enough to the city to be practical, far enough to feel like the countryside.
The Lower Hudson comprises Westchester, Rockland, and Putnam counties, the three southernmost counties in the valley, and sits within the New York City metro. The proximity effect is evident in the data: Westchester, in particular, has pricing that sets it apart from the rest of the valley, with a 90th-percentile threshold of $2,874,400 in April 2026.
Rockland County’s median listing price of $849,500 is the highest of any county across the three Hudson Valley regions, reflecting the persistent demand for housing close to the city on the western bank of the river. Its million-dollar share sits at 30.8%, and while its 90th-percentile threshold of $1,699,000 edged down 5.6% year over year, the overall median has moved up 5.9%, suggesting the broader market is firming even as the top tier sees some recalibration.
Westchester County is the dominant luxury market in the Hudson Valley by nearly every measure. With 470 active million-dollar listings in April 2026, it holds a 32.7% million-dollar share, and luxury properties at the 90th percentile are spending a median of just 43 days on market, down a striking 41.6% from a year ago. No other county in the valley comes close to that combination of volume and velocity.
The county’s housing stock reflects its layered history. The 1950s represent the largest single decade at 20%, the product of Westchester’s post-war suburban buildout, but meaningful pre-war stock remains: 13% from the 1920s and another layer stretching back through the Gilded Age. Roughly 32% of Westchester’s active listings were built before 1950, more than double the national share. That concentration of established, architecturally significant homes, many of them not reproducible under current building standards, is a structural feature of the county’s luxury market.
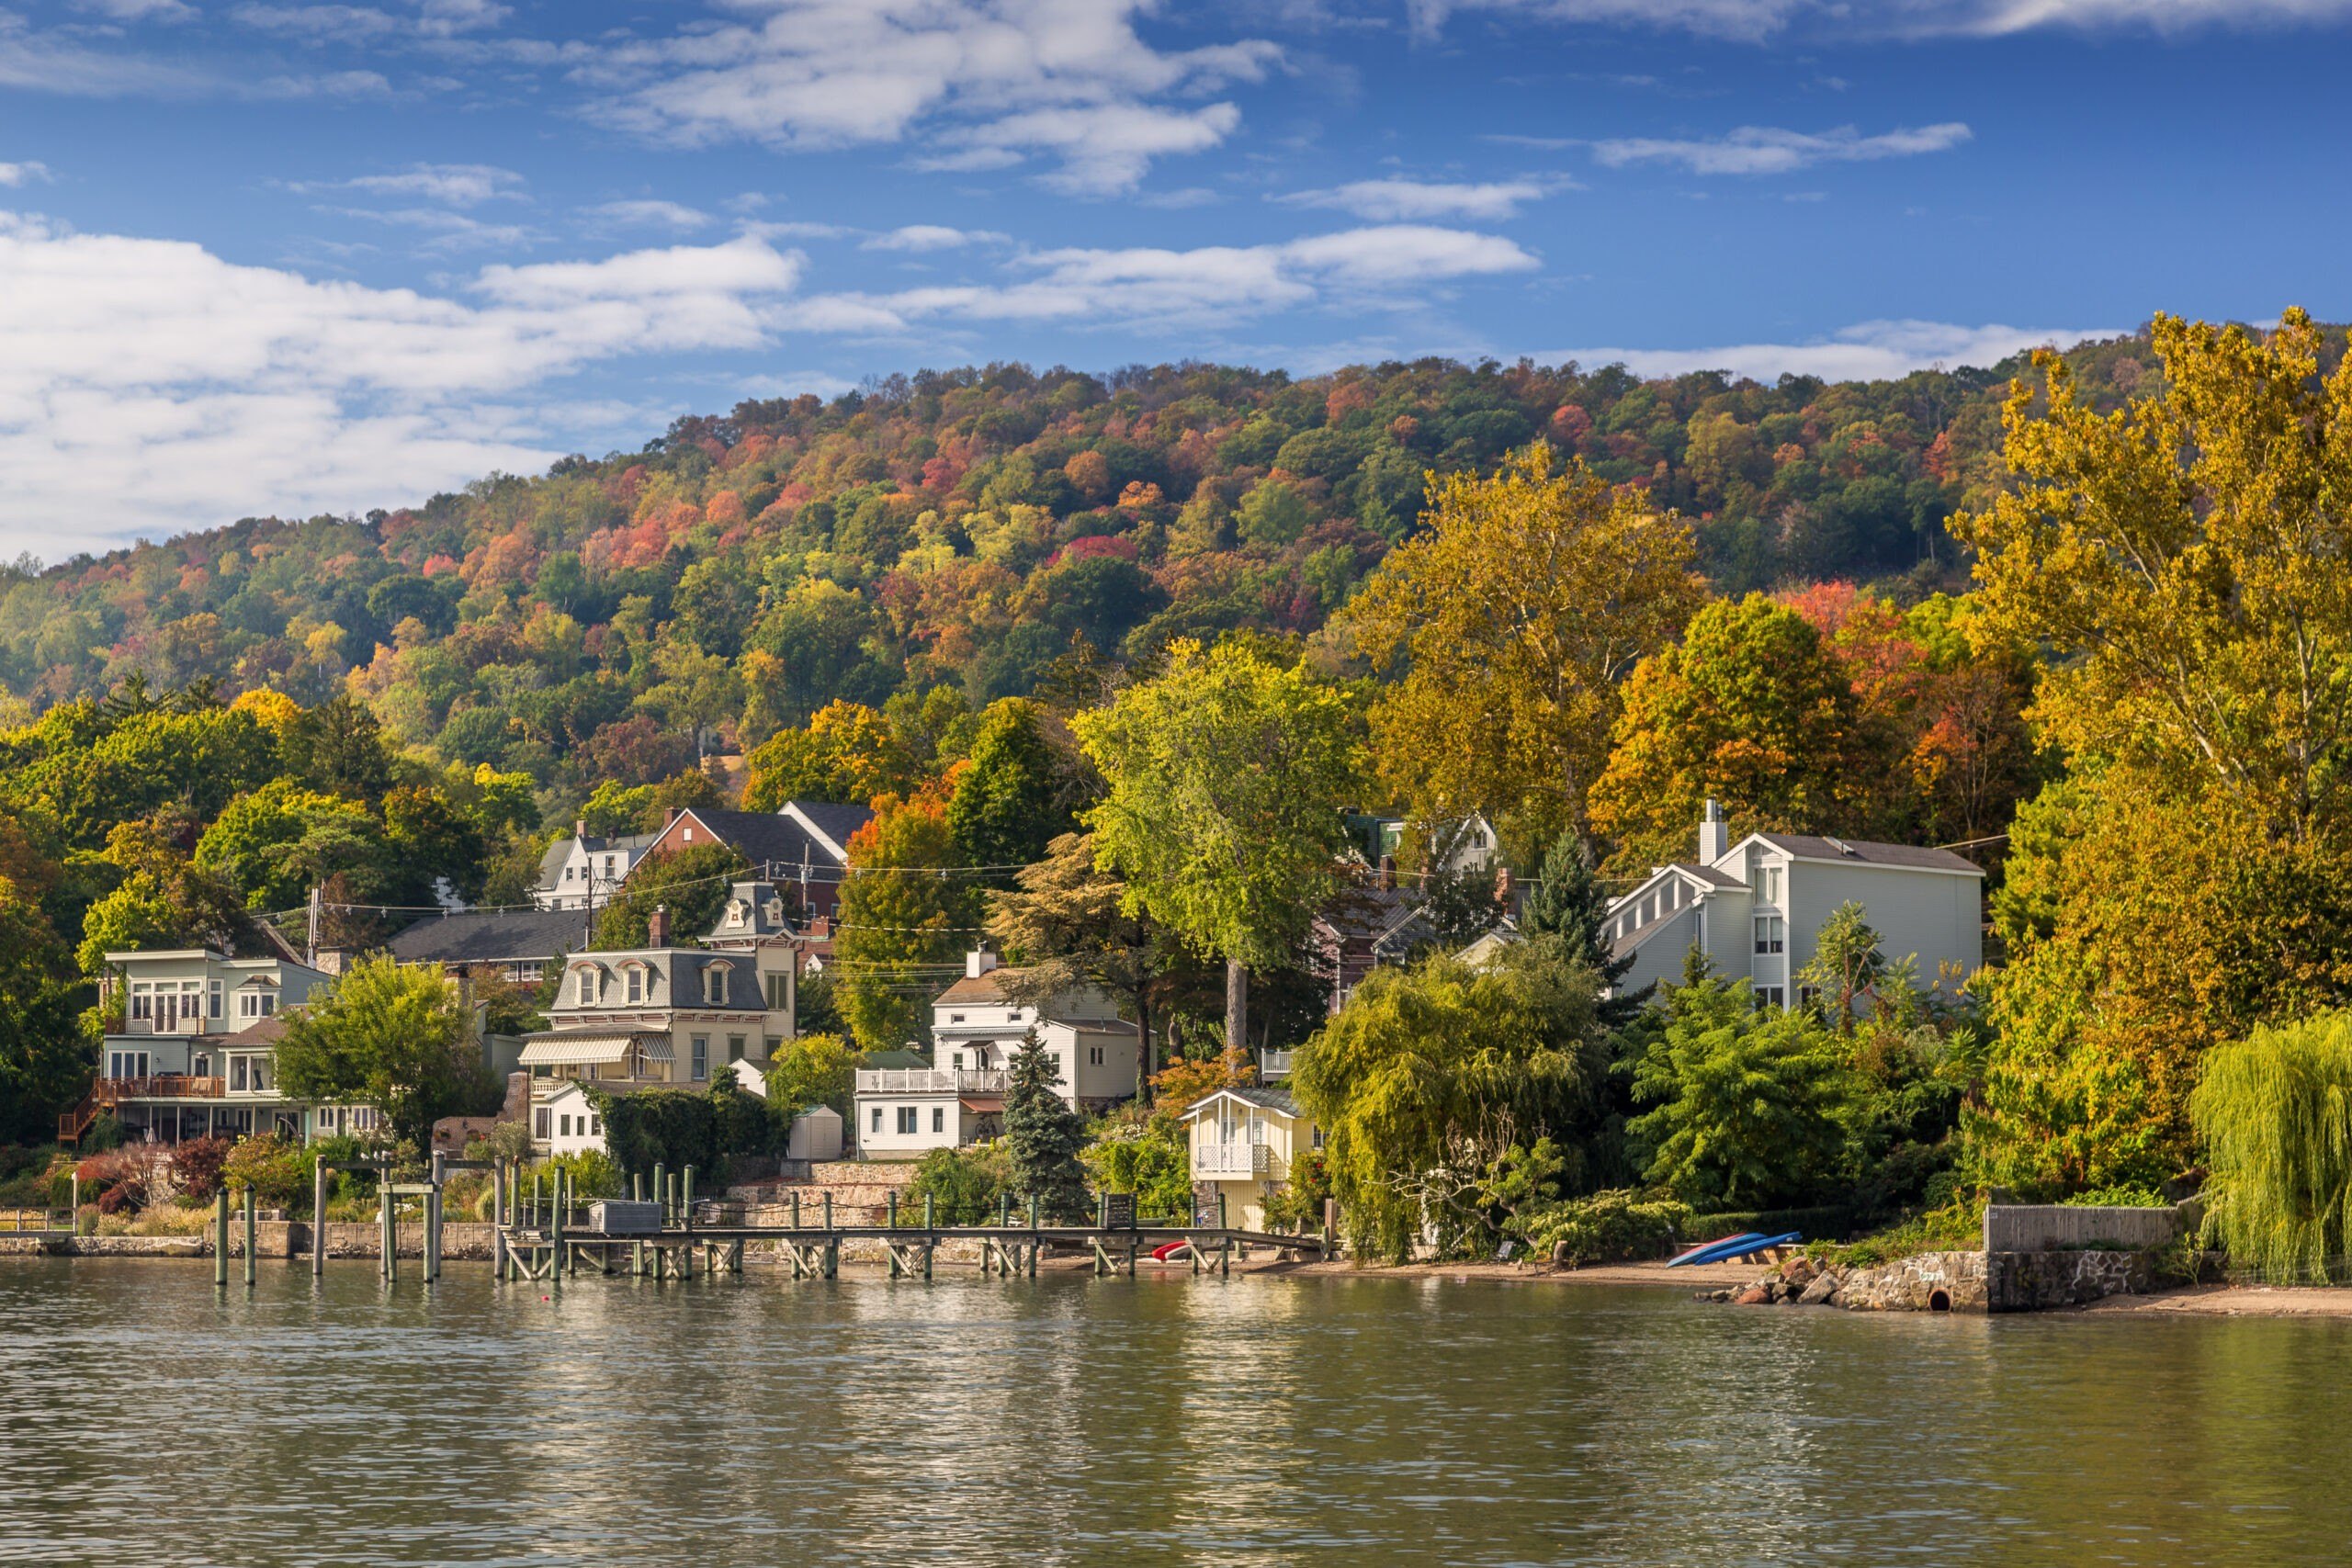
(Rockland County Waterfront – Getty Images)
Rockland County’s construction profile reads differently. The 1960s are the dominant decade at 23%, followed closely by the 1970s at 19%, meaning roughly 42% of Rockland’s active listings were built across just those two decades. That post-war suburban buildout, now 50 to 60 years old, is a key driver of the county’s luxury growth story: homes built in that era have appreciated steadily into the million-dollar tier without the need for new construction to expand the supply. Rockland’s luxury count nearly doubled from its 2016 baseline to its 2025 peak, and the housing stock data explains much of it: a large cohort of mid-century homes reached price levels the data classifies as luxury, driven by demand rather than development.
Putnam County, nestled between Westchester and Dutchess, offers a more transitional luxury profile. With a median listing price of $612,500, a 90th-percentile threshold of $1,336,250, and a 15.8% million-dollar share, Putnam occupies a middle ground between the deep luxury market of Westchester to the south and the estate-driven character of Dutchess to the north.
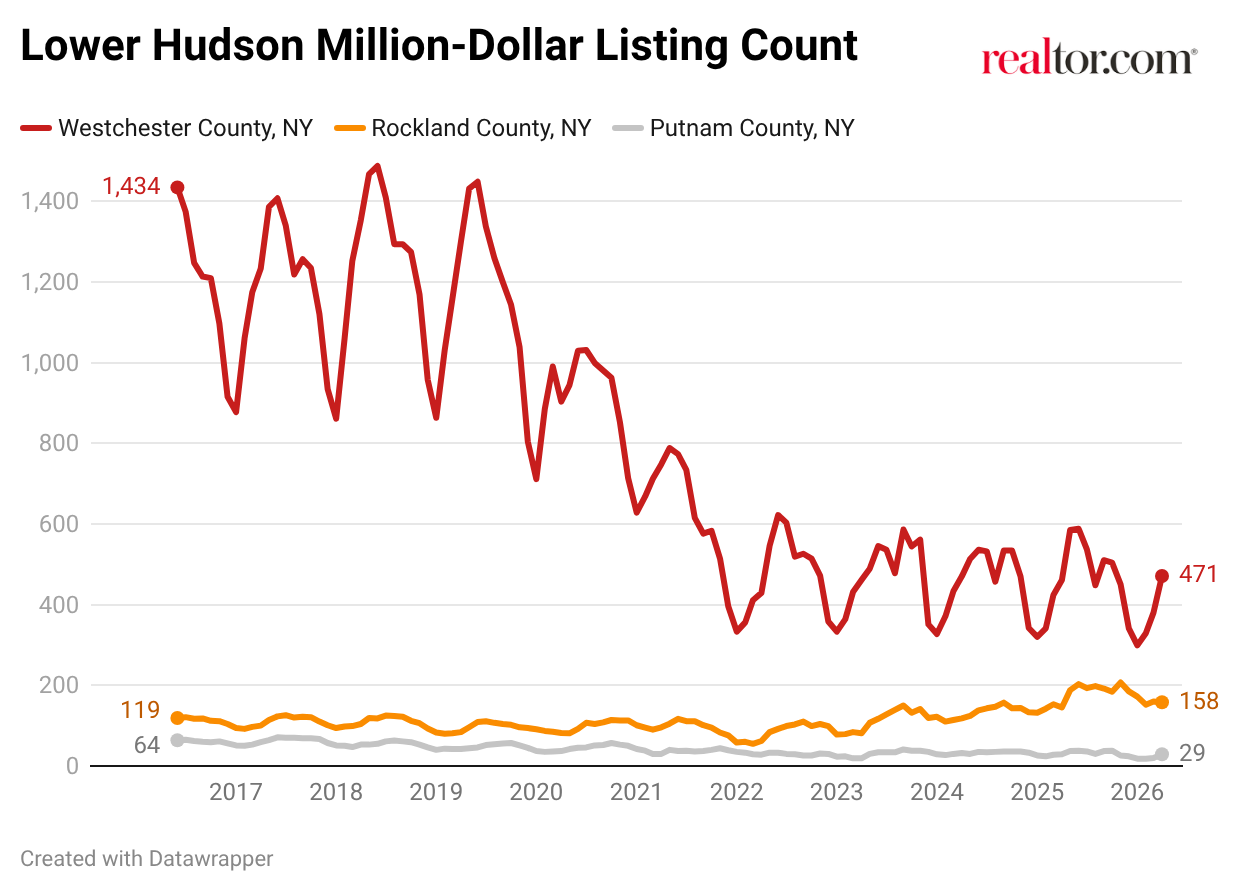
Rockland County is the clearest growth story in the Lower Hudson over the past decade. Million-dollar property counts have climbed from 119 in June 2016 to a peak of 207 in November 2025, a gain of roughly 74% at the high point, before settling to 158 in April 2026. From April 2019 to April 2026, Rockland’s 90th-percentile threshold grew by approximately 89%, more than double the national rate over the same period. That growth has been sustained and broad-based rather than driven by a single cycle: Rockland’s count rose in six of the past seven years, as price appreciation was driven by steady demand from buyers seeking Westchester-adjacent proximity at a lower entry price.
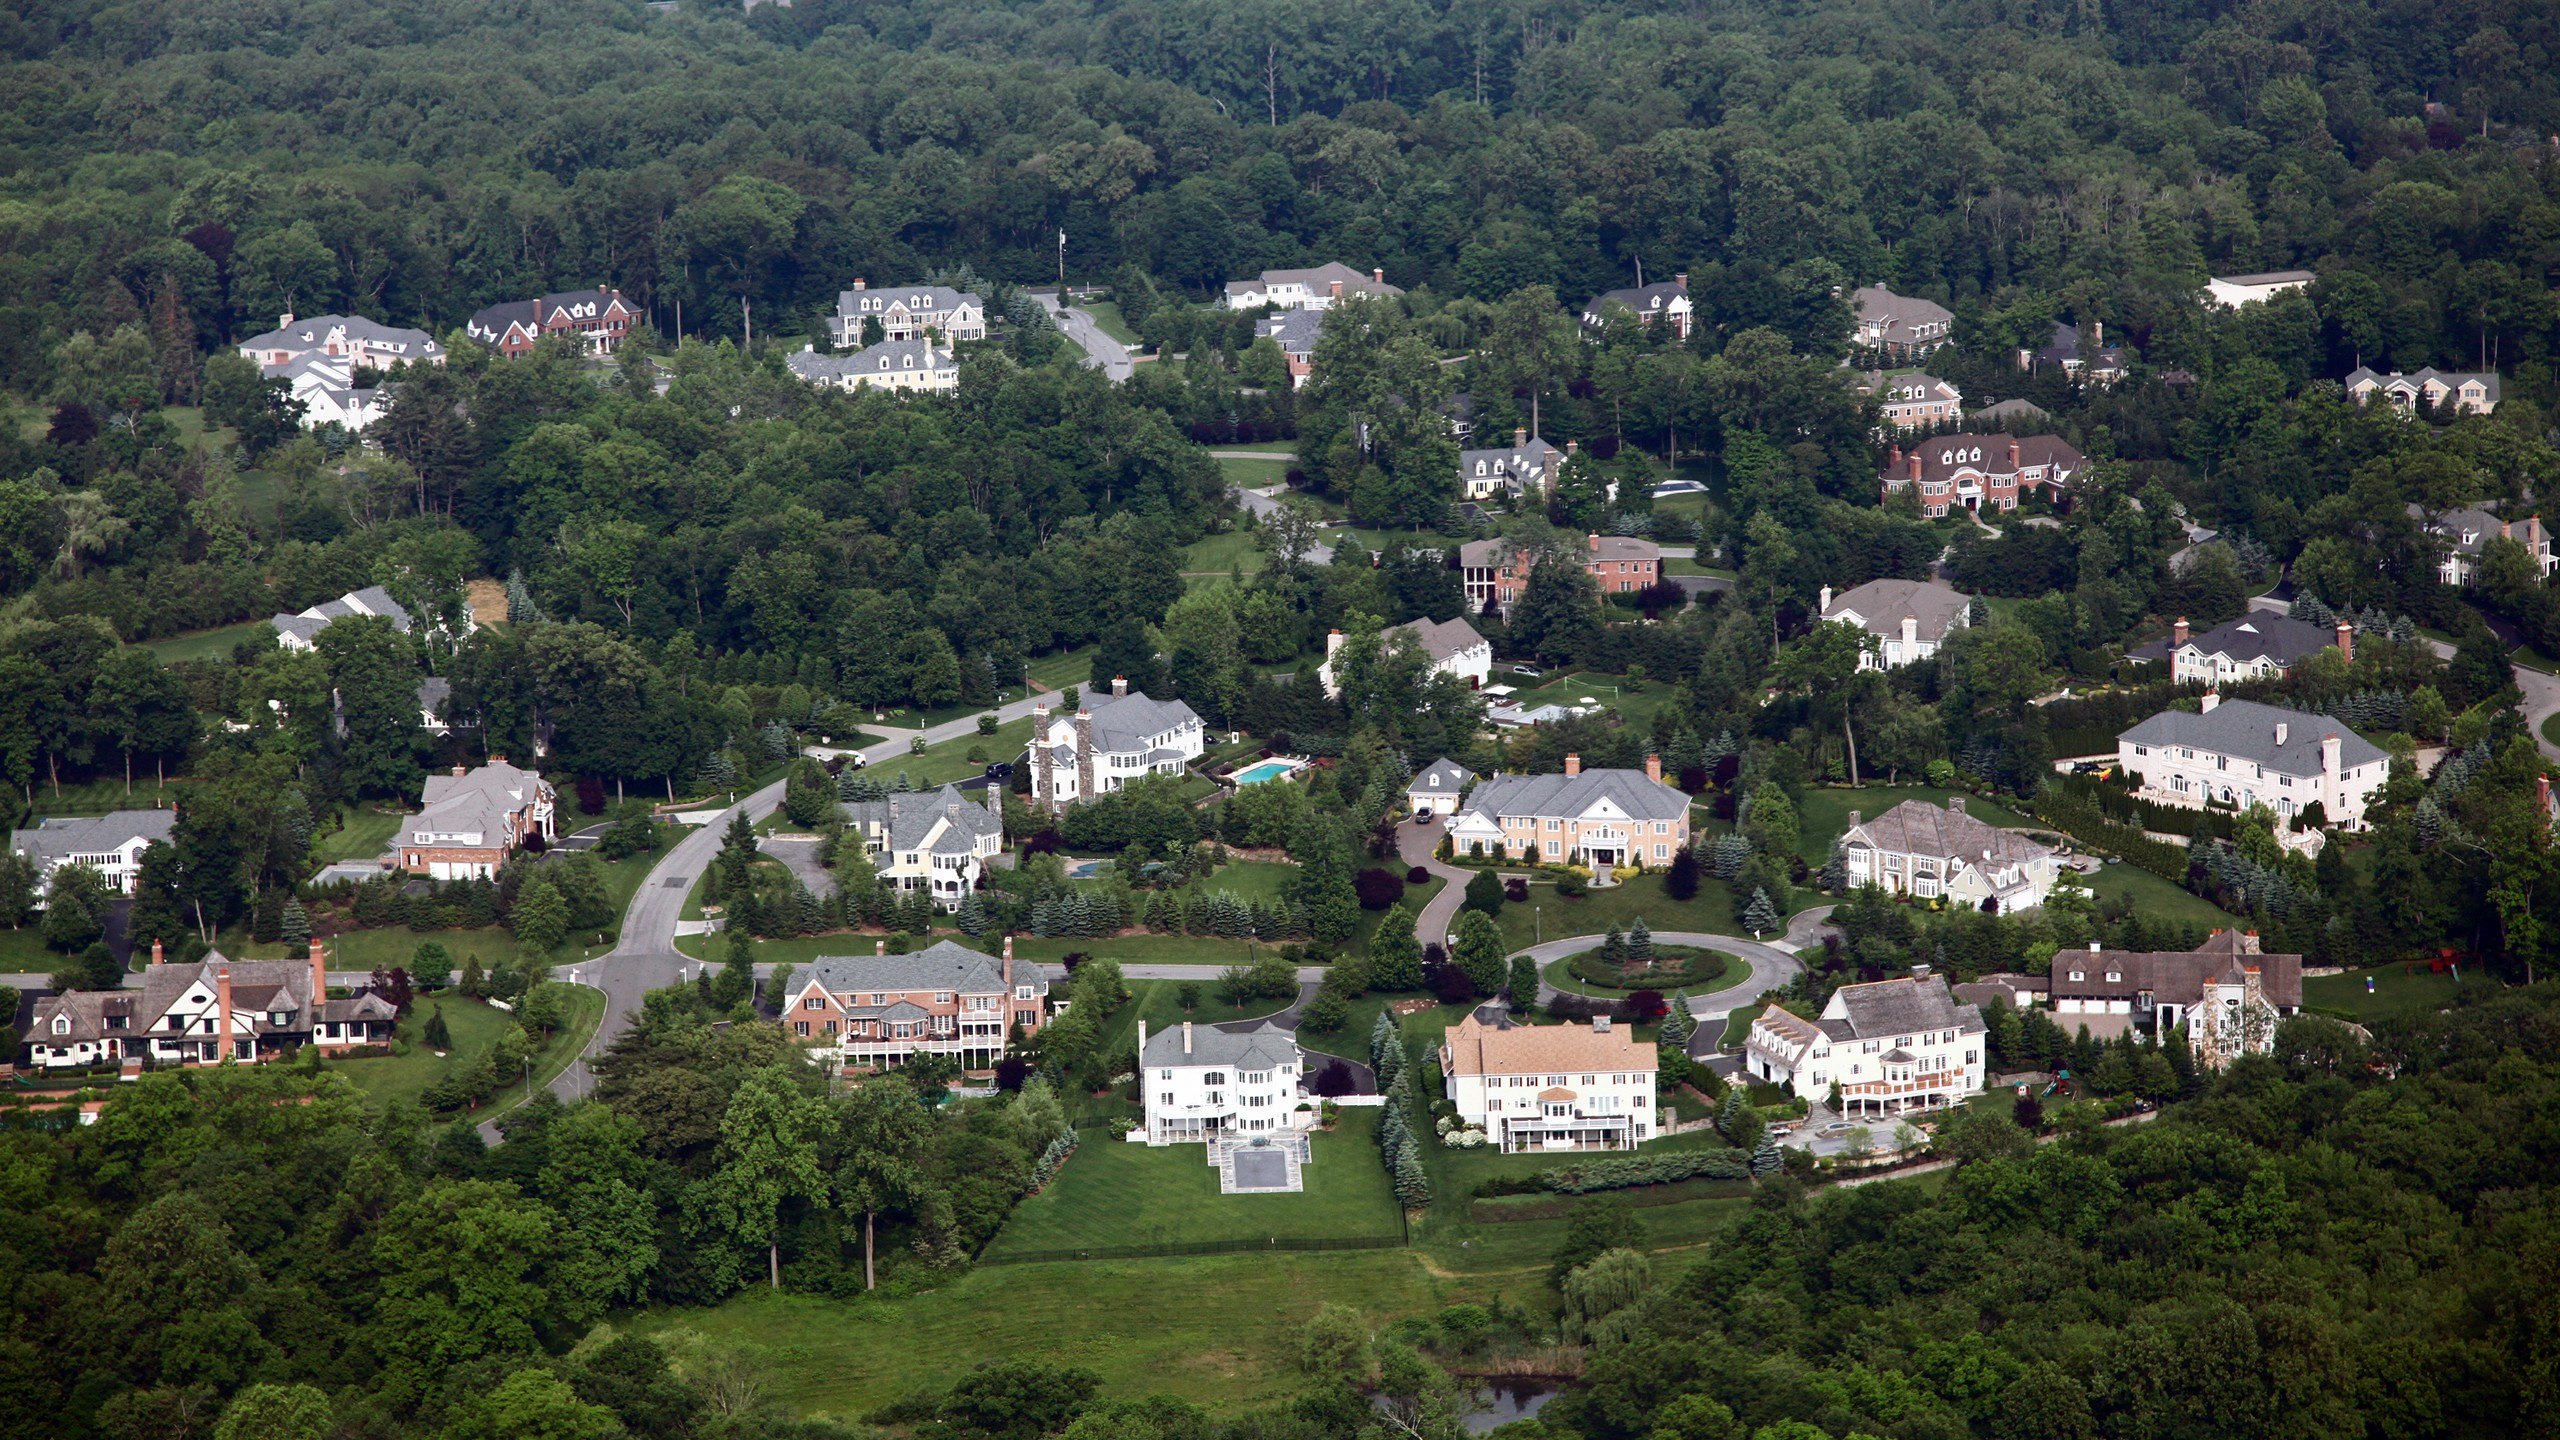
(Westchester County, NY – Getty Images)
Westchester tells the opposite story in terms of raw count, but that decline requires context. From a high of nearly 1,500 million-dollar listings in mid-2018, the county’s count has fallen to 470 in April 2026. From the April 2019 baseline, its 90th percentile price grew by 22%, well below the national rate of 38%, reflecting a market that had already outrun the national benchmark long before 2019. That compression is not a sign of weakness. It is the signature of a mature, supply-constrained luxury market: the limiting factor is available supply, not buyer interest. The 43 days on market in the luxury entry tier, down 41.6% year over year, make clear that when properties do surface, they move. Westchester’s most sought-after communities have little buildable land remaining, and high-end homeowners hold for long periods, meaning visible inventory at any given moment is a fraction of the total value locked in the county’s housing stock.
Putnam County narrowly outpaced the national rate, largely mirroring its neighbors’ patterns. Like Westchester, Putnam’s luxury market is overwhelmingly composed of existing homes, with minimal new construction, meaning the count reflects how many owners are willing to list rather than how much buyer demand there is.
Standout ZIP Codes: Westchester County
| ZIP | Area | Median Listing Price | Million-Dollar Share | Median Days on Market | Median Square Feet |
| 10577 | Purchase | $6,497,000 | 90.0% | 63 | 9,505 |
| 10576 | Pound Ridge | $1,962,250 | 78.8% | 14 | 4,194 |
| 10583 | Scarsdale | $1,495,000 | 68.1% | 21 | 2,925 |
| 10538 | Larchmont | $1,273,000 | 53.1% | 10 | 1,654 |
| 10708 | Bronxville | $400,750 | 18.2% | 40 | 1,004 |
Purchase (10577) occupies a category of its own within Westchester and, arguably, the broader Hudson Valley. With a median of $6,497,000 and homes that can reach past the $20,000,000 mark, nine of the ten active listings are priced above $1 million. Purchase is not a market that generates volume. It is defined by scarcity and the profile of the buyers it attracts: executives, legacy families, and buyers for whom the address itself carries weight. A median square footage of 9,505 reflects homes at a scale simply unavailable elsewhere in the valley.
Pound Ridge (10576) offers the most striking combination of pace and prestige in Westchester, with a 78.8% million-dollar share and a 14-day median days-on-market. Larchmont (10538) is the fastest luxury market in the county, at 10 days, with million-dollar properties clearing in 9 days. At $663 per square foot, the highest in this group, Larchmont buyers are paying a premium for walkability, Long Island Sound access, and a village identity that draws consistent year-round demand from New York City buyers. New construction plays essentially no role in either market. Scarsdale (10583) is the county’s deepest and most liquid luxury market, with 46 million-dollar listings and a 71.3% share across 64 total properties.
Bronxville (10708) is the standout that does not follow the pattern. A $400,750 median sits near the bottom of Westchester ZIPs by that measure, yet the most significant estates here, when they do trade, reach well into eight figures.
Standout ZIP Codes: Rockland County
| ZIP | Area | Median Listing Price | Million-Dollar Share | Median Days on Market | Median Square Feet |
| 10960 | Nyack | $1,222,500 | 67.90% | 68 | 3,014 |
| 10952 | Monsey | $1,150,000 | 55.40% | 59 | 2,448 |
Palisades (10964) is Rockland’s ultimate scarcity story: one active listing, but is known for it’s prestige. Buyers who want a property here often wait years for one to surface. Nyack (10960) anchors the county’s most active luxury submarket with 24 of 37 listings above $1 million, and a waterfront character that has made it a consistent destination for buyers seeking commutable access without Westchester prices. Monsey (10952) reflects community-driven demand, with 30 million-dollar listings among 54 total properties, representing growth significantly shaped by sustained in-migration that has pushed a meaningful share of the housing stock across the million-dollar threshold over the past decade.
Standout ZIP Codes: Putnam County
| ZIP | Area | Median Listing Price | Million-Dollar Share | Median Days on Market | Median Square Feet |
| 10524 | Garrison | $1,275,000 | 53.30% | 28 | 2,585 |
| 10516 | Cold Spring | $618,679 | 7.10% | 41 | 1,548 |
Garrison (10524) is Putnam’s most compelling luxury story: a 53.3% million-dollar share and a 28-day days-on-market that is the fastest in the county. Positioned along the Hudson directly across from West Point, Garrison’s river views and large wooded properties trade infrequently and move quickly when they do. Cold Spring (10516) appears here not for its luxury depth but for its character: a National Historic Landmark village with a Main Street running down to the Hudson waterfront, where the scarcity of available properties reflects long-term owner commitment as much as anything in the data.
Methodology
All data in this report is sourced from Realtor.com® listing trends as of April 2026, reflecting active inventory of existing homes, including single-family residences, condos, townhomes, row homes, and co-ops. Listings reflect only those provided by MLS platforms to Realtor.com through a listing feed. New-construction listings are excluded unless actively listed on participating MLSs.
Luxury segmentation is based on market-specific price percentiles, with the 90th percentile representing entry-level luxury, the 95th percentile marking high-end luxury, and the 99th percentile indicating ultraluxury. All calculations are based on listing prices, not final sales prices.
Metropolitan and micropolitan areas are defined using the Office of Management and Budget’s OMB-2023 delineations, with Claritas 2025 household estimates used for relative comparisons. Where appropriate, we limited analysis to metros or micros with a minimum threshold of active million-dollar listings on average over the past year to ensure meaningful comparisons.
Historical listing trend data extends to July 2016, but year-over-year comparisons in this report use March 2025 as the baseline.
Luxury by the Numbers
90th percentile = Entry-level luxury (top 10% of prices)
95th percentile = High-end luxury
99th percentile = Ultraluxury (often rare or custom properties)


