

National trends
-
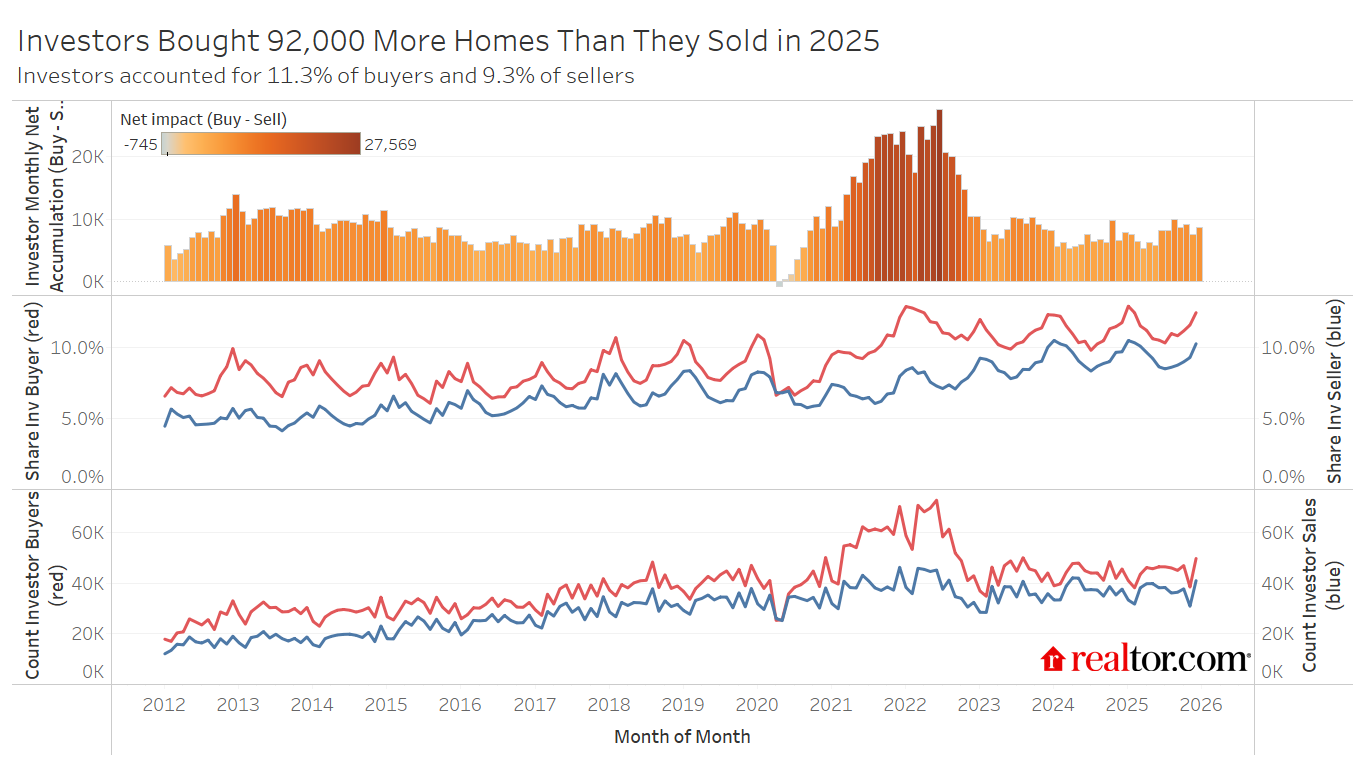
- Buying: Investor buying picked up slightly in 2025, but generally held steady compared to the past few years.
- Investors comprised 11.3% of home purchases in 2025, up 0.3 percentage points compared to 2024.
- Investors purchased about 534,000 homes, up 0.7% year over year in 2025.
- The median investor purchase amount picked up 5.6% year over year, outpacing the overall sale price increase (+2.8%), suggesting that the gap between investor purchase prices and noninvestor purchase prices is narrowing.
- Buying: Investor buying picked up slightly in 2025, but generally held steady compared to the past few years.
- Selling: Investor selling activity slowed in 2025, but remained above pandemic- and pre-pandemic-era levels as a share of home sales.
-
-
- Investor sales comprised 9.3%% of total home sales in 2025, the same share as in 2024.
- Investors sold 442,000 properties, 1.5% less than the previous year, and the lowest number since 2020.
-
-
- Small investors continue to be the dominant force behind investor purchases, comprising about two-thirds of all purchases.
- Large and mega investors have seen the biggest pullback. Mega purchases are down almost 70% compared to their 2021 peak, and large investor purchases are about 30% lower.
Regional Trends
- The Midwest and Sun Belt remain the dominant regions for investor purchases. The Midwest boasts affordability for investors, while poised for growth, and the Sun Belt sees ample inventory and softening prices.
Investor competition may feel like a challenge for many hopeful homebuyers, especially in lower-cost markets where investors are especially active. When inventory was historically scarce during the COVID-19 pandemic, buyers often found themselves competing directly with investors for a small pool of available homes, with investors frequently coming out ahead. Since then, the housing market has changed markedly. Inventory levels in many areas have returned to, or even exceeded, pre-pandemic norms, while home price growth has moderated and rent increases have slowed. In 2025, investor buyer activity held relatively steady both in terms of purchase count and market share.
We use deed data to identify investors. The goal is to get a reading on buy-and-hold, corporate investor activity. The data does not capture mom and pop investors unless they buy using a corporate entity. We also evaluate trends in activity among small-, medium-, large-, and mega-sized investors, as well as state- and metro-level trends.
Investor buyer activity continues to grow in 2025 as the housing market slows
As home sales hit a multidecade low in 2025, investor activity edged slightly higher for the second year, reaching 11.3% of purchases, up from 11.0% in 2024. Roughly 534,000 homes were purchased by investors in 2025, up just slightly from 529,000 in 2024. While investor purchases increased by 0.7% year over year in 2025, noninvestor home sales fell 2.1%. This trend started in 2023 and continued through 2025 as the slowdown in overall homebuying activity and slight uptick in investor activity led to a higher investor share. Zooming out, overall home sales were down more than 25%, and investor purchases were down roughly 22.6% in 2025 compared to the 2021–22 norm at the peak of the pandemic.
While overall home sales declined by 14.3% relative to pre-pandemic levels, a divergence occurred between buyer types: investor acquisitions rose by 14.6%, whereas noninvestor purchases fell by 16.9%. These findings indicate that while investor participation has cooled since the pandemic peak, they remain significantly more engaged than typical buyers and continue to exceed their own pre-pandemic activity benchmarks.
Investor seller activity eases
After two years of elevated selling, investors showed signs of stepping back from the market in 2025. This meaningful shift helped widen the gap between purchases and sales for the first time since the post-pandemic correction began.
The proportion of investor sellers reached its high point of 9.3% in 2024. This peak occurred as operators, who had rapidly increased their holdings during the 2021–22 market surge, began divesting portions of their portfolios. Selling pressure held steady through much of 2024 before easing. Investor sell share remained at 9.3% in 2025, but the absolute count of investor sales edged down slightly, from 448,000 to 442,000. The result was a modest but notable widening of net investor accumulation (buy minus sell), from roughly 80,000 properties in 2024 to 92,000 in 2025.
Despite the year-over-year easing, investor sell share of 9.3% remains well above the pre-pandemic norm of 6.7%, a residual effect of the aggressive accumulation that took place in 2021 and 2022. Still, the direction of travel has shifted. Investors are no longer unwinding pandemic-era positions at the pace seen in 2023 and 2024. Buying outpaces selling by a normal pre-pandemic margin, small investors continue to accumulate steadily, and larger operators are offloading more decisively. The market appears to have found a new equilibrium, at least for current market conditions.
Small investors continue to grow their share of the investor market, mega-investors continue to shrink
The pandemic era reshaped not just how many investors are active in the housing market, but who those investors are. In 2021 and 2022, mega-investors, those with 350 or more purchases in our dataset, drove a disproportionate share of the surge, briefly expanding from their typical 12% of all investor purchases to more than 16% at their peak in 2021. That institutional wave has since retreated sharply. By 2025, mega-investors accounted for just 7.5% of investor purchases, their smallest share since 2011.
Small investors, corporate entities with fewer than 10 total purchases, have always been the majority of the investor buyer market, and that hasn’t changed. What has changed is the margin. As larger operators pulled back, small investors’ share of all investor purchases climbed from 53% at the pandemic peak to roughly 63% in 2025, the highest concentration of small-investor activity in the past 15 years. While all other investor sizes have transitioned to net-sellers over the past few years, small investors are still net-buyers.
This shift is visible in net accumulation as well. While mega-investors went from buying roughly 25,000 more properties than they sold in 2021, to selling roughly 45,000 more than they bought each year over the past three years, totaling roughly 135,000 properties sold. Meanwhile, small investors continue to be net-purchasers, buying 53,000 more properties than they sold in 2025. Small-investor buying activity has been persistently net-positive since 2021. It is, in effect, the stable floor beneath the more volatile institutional activity.
That stability carries an affordability implication. Small investors purchase at a median of $330,000 nationally, about 25% below the overall market median of $440,000. They are not competing with buyers at the median and are instead systematically active in the entry-level tier of the market or in lower-priced markets. In high-investor-share metros like Kansas City, where small investors now account for more than 10% of all home purchases, that concentration is particularly acute, with small investors purchasing at a median of $240,000 against a market median of $347,000, a gap of more than $100,000.
Midwest and Sun Belt drive investor activity
Investor activity in 2025 remains highly concentrated geographically, with a handful of Midwest and Sun Belt markets accounting for disproportionate shares of both investor purchases and the gap between investor and noninvestor buyers.
Memphis, Kansas City, and St. Louis lead the nation among the 50 largest metros, with investor buy shares of 23.7%, 21.2%, and 21.1%, respectively. This means roughly 1 in 4 or 5 homes sold in these markets went to a corporate investor. Birmingham and Oklahoma City round out the top five, with 21.0% and 17.9% investor purchases in 2025. These markets share a profile: relatively affordable median prices, strong rental demand, and sufficient transaction volume to attract both small operators building local portfolios and, increasingly, investors expanding regional footprints.
| Metro Title | 2025 Investor Buyer Share | YoY |
| Memphis, TN-MS-AR | 23.7% | 1.2% |
| Kansas City, MO-KS | 21.2% | 1.5% |
| St. Louis, MO-IL | 21.1% | 1.2% |
| Birmingham, AL | 21.0% | 3.2% |
| Oklahoma City, OK | 17.9% | -1.9% |
| Las Vegas-Henderson-North Las Vegas, NV | 16.5% | 2.7% |
| San Antonio-New Braunfels, TX | 15.9% | 1.5% |
| Dallas-Fort Worth-Arlington, TX | 15.6% | 0.8% |
| Indianapolis-Carmel-Greenwood, IN | 15.1% | -0.5% |
| Cleveland, OH | 15.0% | 2.3% |
The Sun Belt picture is more varied. San Antonio (15.9%) and Dallas-Fort Worth (15.6%) remain deeply investor-active, sustained by population growth and a steady supply of entry-level inventory. Birmingham and Las Vegas saw the most dramatic year-over-year accelerations of large metros, with investor buy share jumping 3.2 and 2.7 percentage points, respectively, to 21.0% and 16.5% in 2025. The surge in Las Vegas was driven in part by softening prices, creating renewed acquisition opportunities for operators who had largely exited the market during the rate-shock correction of 2022–23.
On the other end of the spectrum, pricey West Coast and Northeast markets remain the least investor-penetrated among major metros. Portland (5.8%), Sacramento (6.1%), and Hartford, CT (6.1%), all sit well below the national average of 11.3%, reflecting higher purchasing costs, compressed cap rates, and, in several cases, active policy environments that have made residential investment less attractive. Notably, Sacramento and Portland both registered as net investor-selling markets in 2025, meaning investors collectively sold more homes than they purchased, as investors offloaded some of their pandemic-era accumulation.
| Metro Title | 2025 Investor Buyer Share | YoY |
| Portland-Vancouver-Hillsboro, OR-WA | 5.8% | 0.6% |
| Sacramento-Roseville-Folsom, CA | 6.1% | 1.4% |
| Hartford-West Hartford-East Hartford, CT | 6.1% | 0.5% |
| Seattle-Tacoma-Bellevue, WA | 6.4% | 0.7% |
| Boston-Cambridge-Newton, MA-NH | 7.0% | 0.2% |
| San Jose-Sunnyvale-Santa Clara, CA | 7.1% | 0.6% |
| Riverside-San Bernardino-Ontario, CA | 7.3% | 0.7% |
| Minneapolis-St. Paul-Bloomington, MN-WI | 7.5% | -1.2% |
| Buffalo-Cheektowaga, NY | 7.8% | -0.6% |
| Providence-Warwick, RI-MA | 7.9% | -0.1% |
Atlanta presents perhaps the most striking reversal in the data. Once among the most investor-active markets in the country and a bellwether for institutional single-family rental growth, Atlanta is now the only top-50 metro where investor buy share sits below its pre-pandemic baseline at 10.0% in 2025 against a 2015–19 average of 10.5%. Investors were net sellers in Atlanta in 2025 by nearly 1,800 properties, the largest negative net position of any major metro. The combination of elevated prices, a softening rental market, and significant earlier accumulation appears to have pushed the market into an offload cycle that is continuing to play out.
Headline share figures don’t always tell the full story. Providence, Cleveland, and Pittsburgh each have investor buy shares between 8% and 15%, moderate by national standards. However, all three have seen significant growth compared to their pre-pandemic investor activity. These markets attracted relatively little corporate investor interest before 2020, and small investors have since moved in steadily, drawn by lower prices and strong rental returns.
Who do investors compete with?
Aggregate investor share figures tell part of the story, but the more consequential question for housing affordability is where within the market investor activity is concentrated, and who, specifically, is competing for the same homes. Two metros illustrate the range of dynamics at play in 2025.
Kansas City, MO-KS
Kansas City has long been among the most investor-active major markets in the country, and 2025 marked a new high. Investors purchased 21.2% of homes sold in the metro, up 1.5 percentage points year over year, meaning more than 1 in 5 transactions involved a corporate buyer. Small investors alone accounted for 9.5% of all purchases in 2025, nearly 2.5 percentage points above the national small-investor average.

What makes Kansas City particularly significant from an affordability standpoint is where that activity is concentrated. Small investors in Kansas City purchased at a median price of $240,000 in 2025, against an overall market median of $347,000, a gap of more than $100,000, or 30.8% below market. Investors are systematically active in the lower third of the Kansas City price distribution, the same segment that first-time and moderate-income buyers depend on for entry into homeownership.
That competition has intensified steadily. Kansas City’s investor buy share has risen in each of the past three years, driven almost entirely by small investors whose share of total purchases has climbed from 7.2% in 2019 to 9.5% today.
Charlotte, NC-SC
Charlotte tells a different story, and in some respects, a more encouraging one for prospective homebuyers. After investor buy share peaked at 18.5% in 2022, a surge driven largely by mega and large investors capitalizing on the region’s population growth and pandemic-era price appreciation, activity has pulled back meaningfully. By 2025, investor buy share had fallen to 13.6%, still above the pre-pandemic average, but on a clear downward trajectory.
The composition of that pullback matters. Mega-investors, who briefly accounted for more than a third of investor purchases and 6.4% of all Charlotte home purchases in 2021, had retreated to just 2.3% by 2025, close to their pre-pandemic baseline. What remains is a market increasingly dominated by small investors, whose share has actually grown modestly to 6.2% of all purchases even as total investor activity has declined. The institutional surge has receded; the small-investor presence has not.
The affordability dimension persists nonetheless. Small investors in Charlotte purchased at a median of $250,000 in 2025 against a market median of $410,000, a discount of 39.0%. As in Kansas City, the homes investors are buying are concentrated in the segment most accessible to first-time buyers, even as the overall investor footprint in the metro contracts.
Looking ahead
The 2025 data describes an investor market that has found a new floor rather than continuing to retreat. Investor purchase share has now held above 11% for three consecutive years, and with small investors, the most stable cohort, comprising two-thirds of all investor activity, that floor is unlikely to erode quickly even if financing conditions remain challenging. The composition shift away from mega-investors removes one source of potential future surge, but it also removes the most likely source of large-scale market exit. What remains is a structurally embedded small-investor presence that is particularly acute in affordable Midwest and Sun Belt markets where the competition with first-time buyers is most direct. Absent a significant change in the rental economics that sustain small-investor returns, or policy intervention targeting corporate ownership at the local level, 2025’s elevated-but-stable investor share is likely the new baseline.
Methodology
This report uses deed transaction data to identify corporate real estate investors active in the residential market. Investors are defined as entities purchasing single-family homes, condominiums, townhomes, and related residential property types using a corporate structure—limited liability companies, limited partnerships, general partnerships, trusts, and REITs—with occupancy codes indicating absentee or tenant-occupied use. Builder, relocation service, iBuyer, and financial institution transactions are excluded.
Investors are categorized by total purchase count across the full dataset: small (1–10 purchases), medium (11–50), large (51–350), and mega (351 or more). Because these categories are based on cumulative all-time activity, an entity’s classification reflects its full history in the data rather than its activity in any single year.
Investor seller counts exclude transactions where the seller was disposing of a foreclosure or newly constructed property, ensuring that distressed and new-construction sales are not attributed as investor dispositions. Investor buyer counts include purchases of all qualifying property types regardless of foreclosure or new-construction status, consistent with the goal of capturing bottom-fishing and opportunistic acquisition behavior alongside standard buy-and-hold activity.
Metro-level analysis is restricted to the 50 largest U.S. metropolitan statistical areas by transaction volume. Pre-pandemic benchmarks use 2017–19 averages. All figures reflect transactions recorded through December 2025. Early 2026 data is available but excluded from annual comparisons due to deed recording lag.
Appendix:
| Metro | Count Investor Purchases | Share Investor Buyers | Investor Buyer Median Purchase Amt | Share Investor Sellers | Dif Inv vs. Market Median Purchase Amt |
| Atlanta-Sandy Springs-Roswell, GA | 10245 | 10.0% | $315,000 | 11.7% | -18.4% |
| Austin-Round Rock-San Marcos, TX | 5629 | 12.4% | $408,750 | 11.1% | 0.6% |
| Baltimore-Columbia-Towson, MD | 5354 | 13.3% | $198,000 | 11.5% | -48.6% |
| Birmingham, AL | 5339 | 21.0% | $206,000 | 14.4% | -17.6% |
| Boston-Cambridge-Newton, MA-NH | 3214 | 7.0% | $657,000 | 4.9% | -6.1% |
| Buffalo-Cheektowaga, NY | 819 | 7.8% | $155,000 | 6.0% | -41.5% |
| Charlotte-Concord-Gastonia, NC-SC | 7413 | 13.6% | $300,000 | 11.6% | -25.0% |
| Chicago-Naperville-Elgin, IL-IN | 12351 | 9.9% | $250,000 | 8.1% | -28.6% |
| Cincinnati, OH-KY-IN | 3590 | 11.0% | $164,900 | 9.1% | -41.3% |
| Cleveland, OH | 4192 | 15.0% | $115,000 | 11.6% | -49.3% |
| Columbus, OH | 4170 | 13.4% | $225,000 | 9.1% | -33.8% |
| Dallas-Fort Worth-Arlington, TX | 22421 | 15.6% | $290,625 | 13.2% | -22.5% |
| Denver-Aurora-Centennial, CO | 4088 | 8.7% | $440,000 | 9.0% | -23.5% |
| Detroit-Warren-Dearborn, MI | 7318 | 12.0% | $100,000 | 10.4% | -60.0% |
| Hartford-West Hartford-East Hartford, CT | 761 | 6.1% | $250,000 | 4.2% | -33.3% |
| Houston-Pasadena-The Woodlands, TX | 18465 | 13.5% | $259,023 | 11.7% | -18.2% |
| Indianapolis-Carmel-Greenwood, IN | 7004 | 15.0% | $176,954 | 13.9% | -41.6% |
| Jacksonville, FL | 4881 | 14.5% | $280,000 | 14.1% | -21.4% |
| Kansas City, MO-KS | 9810 | 21.2% | $250,000 | 15.5% | -25.4% |
| Las Vegas-Henderson-North Las Vegas, NV | 7415 | 16.5% | 13.6% | ||
| Los Angeles-Long Beach-Anaheim, CA | 8971 | 11.6% | $1,200,000 | 10.0% | 22.3% |
| Louisville/Jefferson County, KY-IN | 3221 | 13.6% | $185,483 | 11.3% | -30.5% |
| Memphis, TN-MS-AR | 4617 | 23.7% | $126,000 | 17.5% | -46.4% |
| Miami-Fort Lauderdale-West Palm Beach, FL | 13164 | 14.7% | $460,000 | 10.5% | -6.5% |
| Milwaukee-Waukesha, WI | 2189 | 11.1% | $163,500 | 9.9% | -49.3% |
| Minneapolis-St. Paul-Bloomington, MN-WI | 4238 | 7.5% | $284,848 | 10.2% | -25.0% |
| Nashville-Davidson–Murfreesboro–Franklin, TN | 4919 | 11.7% | $550,000 | 10.1% | 20.9% |
| New York-Newark-Jersey City, NY-NJ | 15662 | 10.5% | $680,000 | 7.1% | -0.7% |
| Oklahoma City, OK | 4416 | 17.9% | $138,000 | 16.1% | -43.6% |
| Orlando-Kissimmee-Sanford, FL | 6208 | 13.4% | $355,500 | 10.6% | -12.7% |
| Philadelphia-Camden-Wilmington, PA-NJ-DE-MD | 11026 | 14.1% | $210,500 | 11.0% | -43.1% |
| Phoenix-Mesa-Chandler, AZ | 11331 | 11.8% | $540,000 | 10.8% | 13.4% |
| Pittsburgh, PA | 2940 | 10.1% | $110,000 | 5.7% | -53.2% |
| Portland-Vancouver-Hillsboro, OR-WA | 1853 | 5.8% | $465,000 | 6.5% | -14.5% |
| Providence-Warwick, RI-MA | 1204 | 7.9% | $375,000 | 5.4% | -21.9% |
| Raleigh-Cary, NC | 3257 | 10.0% | $437,750 | 10.6% | -3.5% |
| Richmond, VA | 2189 | 10.9% | $235,000 | 11.2% | -40.0% |
| Riverside-San Bernardino-Ontario, CA | 3850 | 7.3% | $532,000 | 8.1% | -7.5% |
| Sacramento-Roseville-Folsom, CA | 1759 | 6.1% | $690,500 | 6.7% | 15.1% |
| Salt Lake City-Murray, UT | 2029 | 13.5% | $500,000 | 10.4% | -4.8% |
| San Antonio-New Braunfels, TX | 8549 | 15.9% | $225,000 | 13.8% | -23.4% |
| San Diego-Chula Vista-Carlsbad, CA | 3112 | 11.1% | $975,000 | 11.5% | 8.3% |
| San Francisco-Oakland-Fremont, CA | 3167 | 8.6% | $1,475,000 | 8.7% | 28.3% |
| San Jose-Sunnyvale-Santa Clara, CA | 973 | 7.1% | $1,550,000 | 7.5% | 0.6% |
| Seattle-Tacoma-Bellevue, WA | 2935 | 6.4% | $750,000 | 5.6% | 1.8% |
| St. Louis, MO-IL | 11431 | 21.1% | $130,000 | 16.5% | -49.0% |
| Tampa-St. Petersburg-Clearwater, FL | 7581 | 12.8% | $280,000 | 10.3% | -22.4% |
| Tucson, AZ | 1833 | 10.1% | $420,000 | 9.4% | 12.8% |
| Virginia Beach-Chesapeake-Norfolk, VA-NC | 2695 | 9.6% | $200,698 | 9.0% | -42.7% |
| Washington-Arlington-Alexandria, DC-VA-MD-WV | 6605 | 8.7% | $690,000 | 6.6% | 16.9% |


